


Field Service Analytics Software With Real-Time Job Margin
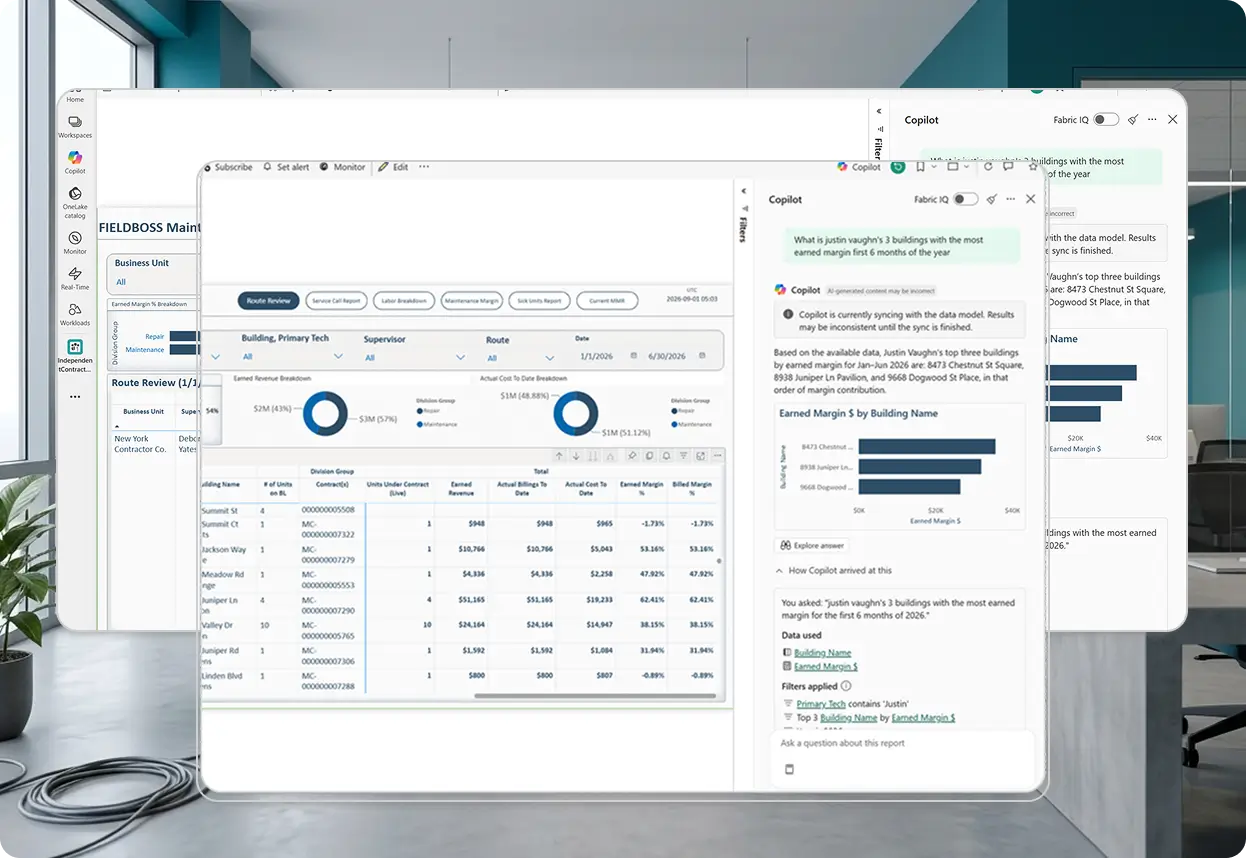
FIELDBOSS Reporting gives owners, GMs, and finance and operations leaders real-time visibility into the business, from job margin embedded on every Work Order to a full library of industry-specific reports built on Power BI and Microsoft Fabric.


































Microsoft Fabric Analytics From Job Site to Boardroom
FIELDBOSS puts real-time job margin on every Work Order, project, and account, then layers in role-based dashboards, 20+ industry reports, an AI data agent, and peer benchmarking through FIELDBOSS Analytics on Microsoft Fabric.
20+ Standard Industry Reports, One Data Foundation
FIELDBOSS Analytics on Microsoft Fabric adds more than 20 pre-built industry reports covering finance, maintenance and service, major projects, quoted repairs, and sales.
Reports run on a pre-built semantic model that unifies finance and operational data, with role- and business-unit-based security, and 2 to 5 second load times.
- 20+ pre-built industry reports
- Unified semantic model for finance and operations
- 2–5 second report load times
- Role- and business-unit-based security controls
See Job Margin Without Leaving the Job
Real-time job margin reporting is embedded directly on every Work Order, project, maintenance contract, building, and account, so FIELDBOSS field service reporting shows profitability right where the work lives.
There’s no separate report to run or export to wait on. Margin updates as the job does, giving office and field leadership the same number at the same time.
- Live on every Work Order, project, contract, building, and account
- No separate report or export needed
- Same number for office and field, in real time
The Right View for Every Role
Role-based dashboards give each person exactly what they need for the day ahead, not a generic view built for everyone.
Dashboards are organized around common roles and daily workflows, so technicians, dispatchers, and finance teams each see what’s relevant to their job, not a view built for an executive.
- Built around common roles and daily workflows
- Built for daily work, not just reporting
- Consistent visibility across office and field
Ask for the Answer in Plain Language
The AI data agent lets users ask reporting and data questions in plain language and get results back without building a report first.
A question like “which mechanic had the most profitable route last month?” returns an answer directly, instead of routing through a report-request queue.
- Plain-language questions return direct answers
- No report-building or IT request required
- Same unified data foundation as core reporting
See Where You Stack Up
Benchmarked industry data shows KPI comparisons across the FIELDBOSS elevator contractor network, so leadership can see how their numbers stack up against peers.
It’s the same data foundation used for reporting, extended to show where a business stands rather than just what it did.
- KPI benchmarking against the elevator contractor network
- Peer comparison beyond your own historical numbers
- Context for ownership and finance leadership
Business Intelligence Built Around What Drives Your Trade
An elevator contractor and an HVAC contractor don’t watch the same numbers. FIELDBOSS reporting speaks to what actually drives your trade instead of one generic dashboard.
Elevator contractors get a contractor KPI dashboard benchmarked against the FIELDBOSS elevator network, so ownership can see maintenance contract profitability and technician performance against real industry peers, not a generic average. Report definitions and measures are built to match how elevator operators actually report internally.
HVAC margins move with the season, and FIELDBOSS’s embedded job margin reporting tracks profitability call by call instead of waiting for month-end to show where things stand. Role-based dashboards keep dispatch, service, and finance looking at the same numbers.
Specialty and multi-trade contractors need one view across every division and job type, not a separate report per trade. FIELDBOSS’s unified semantic model keeps finance and operational data from every business unit in one reporting foundation.
It’s very empowering when you have the right tools. Not just the right tool for now, but the right tool for the future. We know FIELDBOSS will be around 10 years from now. We are looking at our business in full colour now.
Explore Related Features


Works With Your Existing Tools
Frequently Asked Question
Standard FIELDBOSS office licenses already include Power BI field service reporting, covering embedded margin reporting and role-based dashboards. FIELDBOSS Analytics on Microsoft Fabric is an optional add-on that unlocks the full industry report library, benchmarking, and the AI data agent.
Reporting runs on a near real-time refresh, so reports reflect current data as work happens. Built-in date filters let you pin a report to a specific point in time when that’s what you need instead.
The library covers role-based dashboards plus detailed reports across finance, service, sales, repairs, and major projects, along with industry benchmarking so leadership can see how they compare to peers on core metrics.
Yes. FIELDBOSS Analytics gives every customer a private workspace, visible only to them, where existing reports can be brought in or new customer-specific models built. The platform is also designed to connect to external systems for additional reporting needs.
Ready to See Your Numbers in Real Time?
See your own margin, dashboards, and reports in a live walkthrough — no canned demo data.

What is Microsoft Fabric?
Microsoft Fabric is Microsoft’s unified data platform, the foundation FIELDBOSS Analytics builds its industry reporting and AI features on.
It brings finance and operational data together in one semantic model instead of syncing between separate tools, which is what lets FIELDBOSS reports load in seconds and stay current in near real time.
What is a semantic model?
A semantic model is the unified data layer behind FIELDBOSS Analytics that connects finance and operational data so reports and the AI data agent both draw from the same source.
It’s what makes it possible to ask a plain-language question and get a reliable answer, instead of the answer depending on which report happened to be run.
What Is Field Service Analytics Software?
Field service analytics software turns the data a contractor already generates in the field into real-time visibility into margin, productivity, and performance.
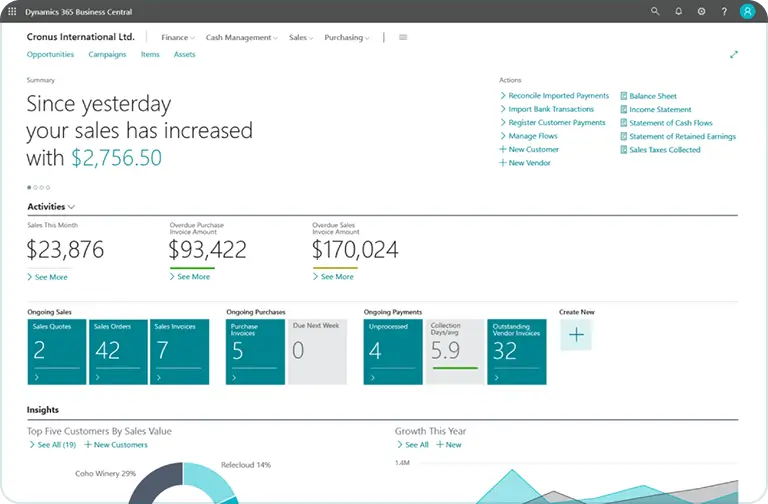
Instead of exporting data into a separate business intelligence tool, it connects reporting directly to the jobs, technicians, and accounts that generated it. Platforms like FIELDBOSS build this on Microsoft Power BI and Fabric within the same Dynamics 365 environment as the rest of the business, so job margin, technician performance, and financial reporting all draw from one data foundation instead of several disconnected systems.